
Signal+
Drive tests you can read at a glance.
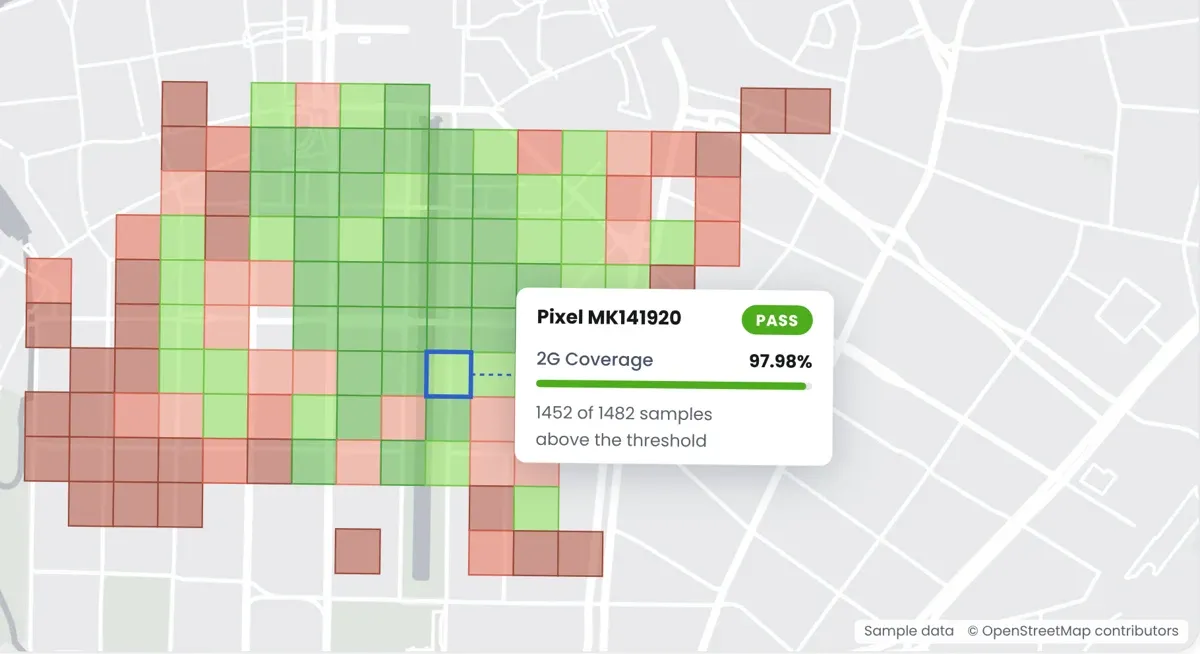
Signal+ groups drive-test samples into pixels on the map. Each pixel passes or fails for 2G and 4G coverage and 5G throughput, and every result opens to the samples behind it.
For RF and optimization teams at operators and their contractors.

What it does
A drive test, read by place.
Signal+ groups the samples from a drive test into pixels on the map. Each pixel passes or fails, shows how close it came, and opens to the measurements behind it.
How it reads a drive test
From samples to pixels.
A drive test leaves thousands of measurements along the route. Signal+ groups them by place, so you look at areas instead of points.

Drive test
Field teams record measurements along the route.

Pixels
Samples are grouped into pixels on the map.

Pass or fail
Each pixel is checked per KPI. One failing KPI makes the pixel red.

Open a pixel
See its samples, its pass rate and the weakest cells.
Pass or fail
Green only when every KPI passes.
Every KPI is checked on its own against its threshold. If one KPI fails, the pixel turns red.
Static sample map with 128 coverage pixels. Switch views to compare pass and fail results, detailed quality levels, or drive-test sample points.
Viewing: 2G Coverage All Samples
Hold Shift and click to select up to 9 pixels.- Overall resultAll KPIs together, the strictest view.
- One KPI at a timeShow 2G coverage, 4G coverage or 5G throughput on its own.
- Operator by operatorSwitch the operator to see where each one passes.
Detailed colors
See how close each pixel came.
Turn on detailed colors and each pixel is shaded by its share of samples above the threshold. Weak spots show up even inside areas that pass.
Static sample map with 128 coverage pixels. Switch views to compare pass and fail results, detailed quality levels, or drive-test sample points.
Viewing: 2G Coverage All Samples
Hold Shift and click to select up to 9 pixels.- 98 to 100%Excellent
- 95 to 98%Very good
- 80 to 95%Moderate
- 60 to 80%Weak
- 0 to 60%Critical
Open a pixel
Every result opens to its samples.
Click a pixel to see its ID and the result per technology. Map view then shows every measurement along the drive route, colored by its value.
Static sample map with 128 coverage pixels. Switch views to compare pass and fail results, detailed quality levels, or drive-test sample points.
Viewing: 2G Coverage All Samples
Hold Shift and click to select up to 9 pixels.- Samples behind the resultTotal samples, samples above the threshold and their share, for each KPI.
- Weakest cellsTop bad performers lists the cells with the most failed samples.
- Up to nine pixelsHold Shift and click to select up to nine pixels.
Filters
Ask the map the question your team has.
The filters along the top of the map change what every pixel shows. Hold Shift and click to compare up to nine pixels.
- Data sourcePick where the measurements come from.
- LayerRead the results as pixels on the map.
- OperatorSwitch operators to compare where each one passes.
- KPISee the overall result, or one KPI on its own: 2G coverage, 4G coverage or 5G throughput.
- Detailed colorsShade each pixel by its share of passing samples, so weak spots show inside passing areas.
- DatesLimit the map to the drive tests from a period.
Where teams use it
Three places to look closer.

Dense city areas
Find weak pockets inside the city and the cells behind them.

Highways and corridors
Check the roads people drive, pixel by pixel, before complaints come in.
Operator comparison
Switch the operator to see where each one passes, by KPI.
From result to action
A failed pixel can start the work.
Signal+ runs next to AnyWork. A failed pixel can open a process, such as a new drive test or a coverage request, and the result stays with the case.
See Signal+ in a demo.
Tell us how your team reviews drive tests today. We show you how it reads in Signal+.